Share this link via:

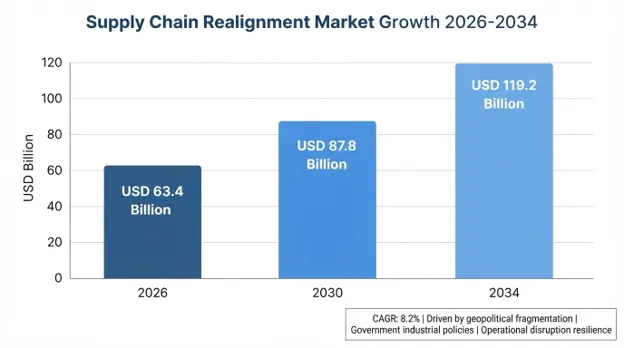
The global supply chain realignment market was valued at approximately USD 58.5 billion in 2025 and is projected to reach USD 63.4 billion in 2026, expanding to nearly USD 119.2 billion by 2034, registering a compound annual growth rate of approximately 8.2% during the forecast period of 2026 to 2034.
Supply chain realignment is the deliberate, strategic reconfiguration of manufacturing geography, supplier networks, logistics corridors and inventory architectures caused by geopolitical fragmentation, trade policy volatility and repeated operational shocks highlighting the fragility of decades-long and cost-optimized global sourcing models. The market is a mix of strategy consulting, supply chain engineering, digital analytics and logistics infrastructure from project-based network redesign to continuous managed services, tuning global operations into a rapidly changing environment.
This market came into sharp focus due to a series of cascading shocks. The United States-China trade war that started in 2018 also brought persistent uncertainty over thousands of product categories, compelling multinational corporations to reconsider the actual cost of the land-based supply chain they have developed over Asia. The COVID-19 pandemic then proved the vulnerability of this lean and just in time manufacturing concept by a combination of demand shocks, closed ports and closed factories, resulting in shortages in semiconductors, pharmaceuticals and consumer electronics. The Suez Canal closure in 2021 underlined the ability of one chokepoint to paralyses billions of dollars in trade every day, while the Russia-Ukraine conflict starting in 2022 has had a global impact on energy markets and European manufacturing inputs affecting multiple continents. A series of such events changed the mindset of companies and governments from simply optimizing, to focusing on resilience: geographic diversification, redundancy and real-time visibility are becoming more strategic assets than cost inefficiencies.
Governments have supported this change with active industrial policy measures such as the U.S. CHIPS and Science Act, which has committed USD 52.7 billion to support domestic manufacturing and research in semiconductors; the Inflation Reduction Act's domestic content requirements for electric vehicle batteries and clean energy equipment; and the European Union's Chips Act and Critical Raw Materials Act, which has set binding 2030 goals for extraction, processing, and recycling of strategic materials. Strategic advisory and network-design consulting, technology platforms that facilitate multi-tier visibility of suppliers and risk monitoring, and logistics and industrial infrastructure investments for new nearshore and regionalized manufacturing hubs are commercial examples of the market, making supply chain resilience a standing item on the Board's agenda and the audit committee's agenda.
| Report Coverage | Details |
|---|---|
| Base Year | 2025 |
| Base Year Value | USD 58.5 Billion |
| Forecast Value | USD 119.2 Billion |
| CAGR | 8.2% |
| Forecast Period | 2025-2034 |
| Historical Data | 2022-2025 |
| Largest Market | North America |
| Fastest Growing Market | Asia Pacific |
| Segments Covered | By Component, Realignment Strategy, Technology, Enterprise Size, Industry Vertical, End-User, Region |
| Region Covered | North America, Europe, Asia Pacific, Middle East & Africa, Latin America |
| Countries Covered | US, Canada, Mexico, UK, Germany, France, Italy, Netherlands, China, Japan, India, Vietnam, South Korea, Australia, Brazil, UAE, Saudi Arabia, South Africa |
| Key Market Playes | Accenture plc, McKinsey & Company, SAP SE, Oracle Corporation, IBM Corporation, DHL Supply Chain, Blue Yonder Group Inc. |
Get more details on this report - Request Free Sample
The structural competition between the United States and China has resulted in successive waves of export controls on semiconductors and dual-use technologies as well as comprehensive tariffs, leaving companies with strong connections as a sourcing region and export factory with uncertainty on costs and compliance. The practical answer has been to diversify with tactics that can be summed up as China Plus One, nearshoring and friend-shoring, and Vietnam, India, Mexico and Poland are the main geographies for manufacturing investment that has been redirected.
Extreme weather events, port congestion, cyber incidents and sudden demand-supply imbalances have become normal and recurring parts of the operating environment, bringing fragilities to lean, globally concentrated networks. This has increased the need for manufacturers with long lead times and complex bills of material for multi-tier supplier mapping, quantitative stress testing, and regionalized stocking strategies.
It takes two to five years from site selection to being fully productive with new manufacturing capacity, which can be onshore, nearshore or reshored, and during that time the company must pay for two sets of running costs yet not benefit from the economies of scale and skilled workforce developed over decades in established manufacturing hubs. A major disadvantage of reshoring to Western countries and North America is that many of their operations tend to include meaningful premiums in labor costs compared with Asian options, and advanced network design and digital twin modeling rely on the skills that are in short supply and are likely to require external advisory partners, which raises program governance risk.
AI-Driven Digital Twins and Scenario Modeling:
Virtual copies of end-to-end supply networks enable organizations to take risks and test proposed footprints under disruption scenarios prior to committing capital, while real-time input from the IoT, including sensors and geopolitical risk indicators, can be used to produce prescriptive recommendations for where facilities should be located, and where different suppliers would be sourced. An early mover strategy for vendors who bundle modeling software with execution advice can lead to high dollar, long-term customer relationships.
Nearshore Infrastructure and Logistics Corridor Development:
As manufacturing investments have shifted quickly to Mexico, Eastern Europe and Southeast Asia, there is significant demand for logistics real estate, port capacity and trade facilitation in these new regions for industrial real estate providers and infrastructure developers to develop the infrastructure necessary to support continued nearshoring investment activity over a multi-year period.
Businesses are moving away from a single global integrated network to multiple but partially overlapping regional networks for North America, Europe, and Asia Pacific that use local sourcing and distribution, thus minimizing risks while maintaining economies of scale in their respective regional markets.
Network design is moving away from being done on a periodic, decade-by-decade basis to become a continuous process of optimization, made possible by the help of control towers and managed services that have predictive risk warnings and playbooks for quick changes to routes, modes, and inventories.
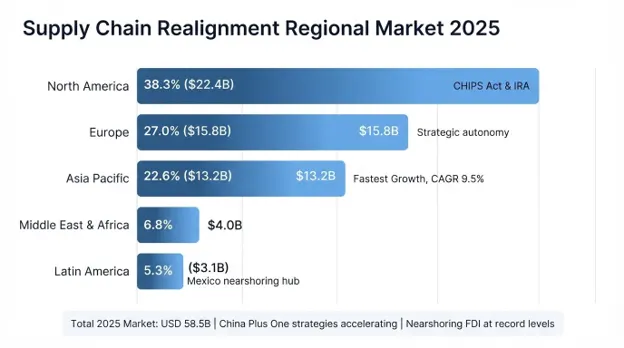
North America has the highest market share at around USD 22.4 billion in 2025 with a CAGR close to 7.9%, owing to active industrial policies like the CHIPS Act and the Inflation Reduction Act, heavy nearshoring investment in Mexico, and the presence of leading consulting firms, technology firms, and logistics firms based in the United States.
Europe comes second with the market size estimated to be around USD 15.8 billion in 2025, attributed to decreased reliance on energy from Russia and its raw material since 2022, as well as the strategic autonomy aspirations of semiconductors and critical materials from European Chips Act and Critical Raw Materials Act in Poland, Czech Republic, and Morocco.
Asia Pacific region will be the fastest growing one, being worth approximately USD 13.2 billion in 2025 with a CAGR exceeding 9.5% until 2034 while fulfilling a dual purpose of the traditional manufacturing hub facing pressure to diversify as well as the main realigning investment destination in India, Vietnam and Indonesia.
The Middle East and Africa along with Latin America regions will amount to approximately USD 7.1 billion in 2025, with Mexico remaining the largest nearshoring destination for North American manufacturing companies, and UAE and Saudi Arabia investing in logistics hubs to connect Asian, European and African trade routes.
Component Insights: The service component is larger, representing strategy services, network design services, and compliance services needed for managing foreign taxes, labor, and regulations while physically transitioning. The solutions and software component represent the rapidly growing segment as companies progress from strategic planning to execution and monitoring phases.
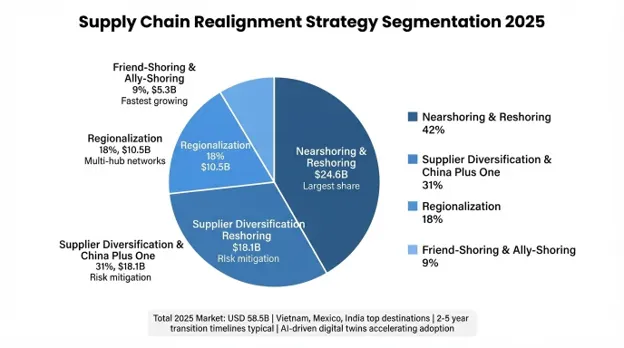
Realignment Strategy Insights: Nearshoring and reshoring account for the biggest proportion of the strategies being deployed, owing to the advantage of being close to the markets served by using geographic proximity to minimize risks in terms of logistics and transit. Supplier diversification in the form of “China Plus One” models is a close second.
Technology Insights: Demand forecasting, supplier risk assessment, and logistic optimizations are some of the applications where artificial intelligence and machine learning are taking the front seat. Digital twin technology is one of the fast-growing technologies that help validate network redesign decisions prior to making any investment decisions.
Industry Vertical & End-User Insights: The re-alignment market for electronics and semiconductors is the most intense one because of its high level of investment due to government policies and strategic importance, followed by the automotive sector due to developments in batteries for electric vehicles. The manufacturers account for the biggest proportion of re-alignment investments, while third-party logistics are the fastest-growing end-users of this type of service.
The market is segmented among strategy consultants, enterprise technology platform providers, and logistics service integrators, without any one player being dominant in each category. Top-tier consultants have a superior position when it comes to network-redesign strategy projects, enterprise software providers bid for multi-year technology platforms, and global logistics providers offer advisory services and technology along with core business to gain revenues from realignment initiatives. Differentiation lies in the ability to integrate strategy consultancy and execution services, AI/simulation competencies, and relationships in emerging nearshore geographies.
March 2026: SAP SE added generative AI functionalities to its SCM solution, offering natural language scenario planning and automatic assessment of multi-level supplier risks.
February 2026: DHL Supply Chain committed to invest several billion dollars in building logistics facilities in Mexico, Poland, and Vietnam to support customers’ nearshoring requirements through 2028.
December 2025: IBM Corporation closed an acquisition deal for a platform that monitors geopolitical disruptions to the supply chain, adding this functionality to the Sterling Supply Chain Suite.
November 2025: McKinsey & Company extended its Supply Chain & Operations practice by opening digital capability centers in Mexico, India, and Vietnam to help customers implement China Plus One and nearshoring strategies.
You'll get the sample you asked for by email. Remember to check your spam folder as well. If you have any further questions or require additional assistance, feel free to let us know via-
+1 724 648 0810 +91 976 407 9503 sales@intellectualmarketinsights.com
12 Aug 2026
Intellectual Market Insights Research © 2026. All rights reserved.