
Air Defense System Market Size, Share, Top 25 Companies & Growth Trends 2026–2032
Author:
Intellectual Market Insights Research
Published Date:
27 Jul 2026
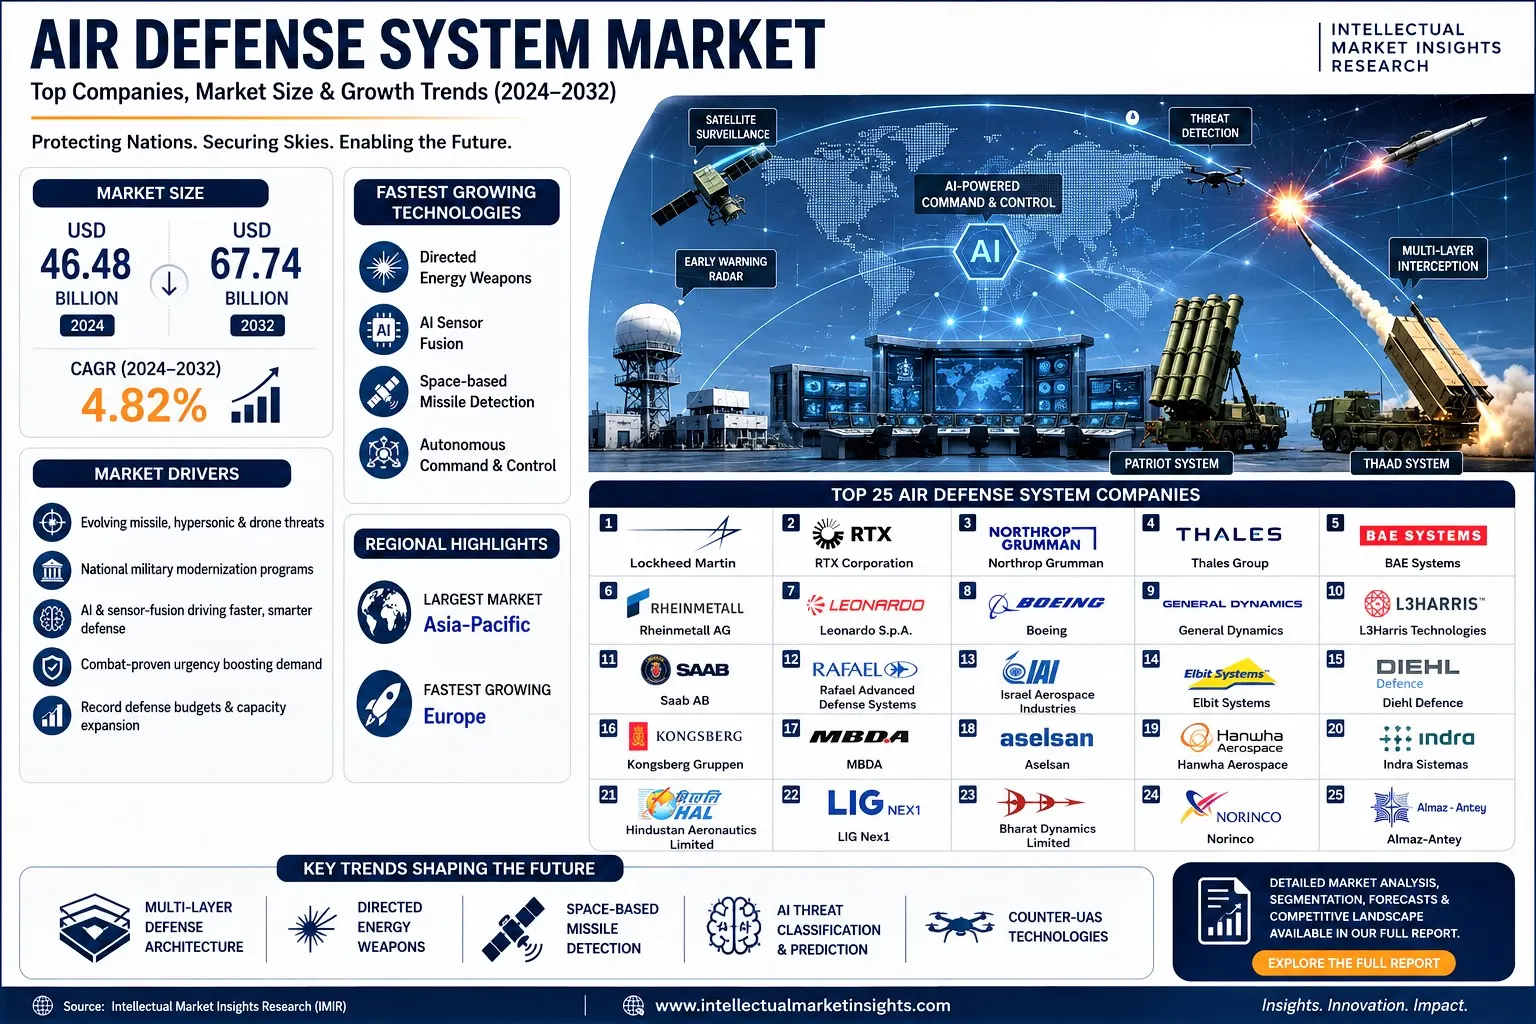
Air Defense System Market: Size, Share, Top 25 Companies & Growth Trends (2024–2032)
The global Air Defense System Market was valued at USD 46.48 billion in 2024 and is projected to reach USD 67.74 billion by 2032, growing at a CAGR of 4.82% (2024–2032), driven by an evolving threat landscape of ballistic missiles, cruise missiles, hypersonic weapons, and drone swarms, and by flagship national programs such as the U.S. "Golden Dome for America" and Europe's Sky Shield Initiative.
Market Overview
Air defense systems protect land, naval, and airborne assets against missiles, aircraft, and drones; the market is worth USD 46.48 Bn (2024) and is forecast to hit USD 67.74 Bn by 2032. Key Takeaway: Growth is steady rather than explosive at the market-sizing level (4.82% CAGR), but underlying segments like missile defense and counter-drone are compounding much faster because of active conflicts and national shield programs. Expert Insight: The gap between the "headline" market CAGR and the much hotter growth in missile-defense and counter-UAS sub-segments is itself a story — capital is concentrating in specific technology layers rather than spreading evenly across the whole air-defense stack.
Air defense systems are the ground-, sea-, and air-based architectures that detect, track, and intercept aerial threats — from legacy crewed aircraft to ballistic and cruise missiles, hypersonic glide vehicles, and unmanned aerial systems. Modern warfare has compressed reaction windows and multiplied the variety of threats a single system must handle, which is why most large-scale defense primes are funneling capital into next-generation interceptors, sensor fusion, and AI-assisted command-and-control.
Two flagship state programs currently anchor demand. The United States has begun funding the "Golden Dome for America" homeland missile shield — a layered, "system of systems" architecture combining space-based sensors, space-based and ground interceptors, and next-generation radar, with an initial $17.9 billion tranche in the FY2027 budget submission and Congressional Budget Office estimates suggesting total lifecycle costs could run as high as $1.2 trillion over 20 years. In parallel, Europe's European Sky Shield Initiative (ESSI), now spanning more than 20 nations, is pooling procurement of short-, medium-, and long-range systems (IRIS-T SLM, Arrow 3/4, Patriot) in direct response to the war in Ukraine and Russia's expanding missile inventory.
For deeper segment-level data, IMIR's related Global Missile Defense Systems Market and Global Electronic Warfare (EW) & Counter-UAS Market reports break these adjacent categories out in full.
Market Drivers
The primary driver is the diversifying threat environment — ballistic and cruise missiles, hypersonic weapons, and swarming drones — combined with record national defense budgets.
Governments are not just buying more of the same systems; they are funding entirely new architectural layers (space-based sensing, directed energy) that didn't exist as procurement categories a decade ago.
Budget growth alone doesn't explain the surge — it's the shift from "buy when threatened" to "build ahead of the threat," visible in primes like Lockheed Martin now developing systems speculatively rather than waiting on formal Pentagon requests.
- Evolving threat landscape: Continuous diversification of airborne threats — from ballistic and cruise missiles to hypersonic glide vehicles and low-cost drone swarms — is forcing continuous system upgrades across radar, interceptors, and command-and-control layers.
- National military modernization programs: Golden Dome (U.S.), the European Sky Shield Initiative, and the EU's broader ReArm Europe/Readiness 2030 plan (proposing over €800 billion in defense spending) are all direct demand catalysts.
- AI and sensor-fusion integration: Machine-learning-enabled threat classification and multi-sensor fusion are improving detection speed and reducing false-positive rates, making systems more attractive to budget-constrained buyers.
- Combat-proven urgency: Real-world interceptor consumption in Ukraine (Patriot, NASAMS, IRIS-T) and in the Middle East (Iron Dome, THAAD, Patriot against Houthi missile and drone strikes) has driven a reported 340% increase in interceptor production capacity across Western manufacturers.
Market Restraining Factors
Budget constraints and the high unit cost of advanced interceptors remain the biggest brakes on faster market growth.
The "cost-per-kill" problem — where a multi-million-dollar interceptor is used against a cheap drone — is now an explicit strategic concern, not just a budgeting footnote.
This restraint is exactly why directed-energy weapons and lower-cost kinetic interceptors are attracting disproportionate R&D investment relative to their current market share — it's a bet on flattening the cost curve.
Budgetary competition with other national priorities, the high development and procurement cost of radar and interceptor technology, and the strain of sustaining systems over multi-decade lifecycles all constrain how fast governments can scale deployment, even where the strategic need is undisputed.
Opportunities
- Directed-energy weapons: Laser-based interception (e.g., Rafael's Iron Beam) is being positioned as a lower-cost-per-engagement complement to kinetic interceptors, with executives publicly discussing scaling toward ballistic-missile-capable variants.
- Space-based sensing and interception: Golden Dome's architecture is creating an entirely new commercial space-defense supply chain around missile-tracking satellites and space-based interceptors.
- Sovereign and indigenous programs: India, Turkey (H?SAR, S?PER), South Korea, and others are investing in indigenous systems to reduce import dependence, opening opportunities for technology-transfer partnerships.
- Software-defined and subscription-based models: Emerging in adjacent counter-drone markets, subscription and software-defined pricing is starting to influence how larger air-defense platforms are packaged and sold.
Search Intent & Content Structure
Readers researching "air defense system market" typically mix informational intent (what it is, how big it is) with commercial and comparison intent (which companies lead, how they compare).
This pillar is structured to answer the informational query first (definitions, sizing, drivers) before moving into the commercial/comparison layer (company profiles, tables) that procurement and investment audiences need.
Structuring AI-Overview-style Quick Answer/Key Takeaway/Expert Insight blocks ahead of every major H2 is specifically aimed at featured-snippet and AI-search-engine extraction, where the first 2–3 sentences under a heading are disproportionately likely to be lifted verbatim into an AI Overview.
|
Intent Type |
Representative Query |
Content Section |
|---|---|---|
|
Informational |
"What is an air defense system" |
Market Overview |
|
Primary/Commercial Investigation |
"Air defense system market size" |
Market Overview, Segmentation |
|
Comparison |
"Lockheed Martin vs RTX vs Thales air defense" |
Comparison Tables |
|
Commercial/Investment |
"Top air defense companies to invest in" |
Top 25 Companies, Investment Analysis |
|
Long-tail/Question |
"Why is the air defense market growing" |
Market Drivers, Industry Trends |
Research Methodology
This pillar synthesizes IMIR's own live Air Defense System Market report data with verified 2025–2026 company filings, industry news, and defense-trade press, cross-checked against multiple independent sources before inclusion.
Every figure in this article is either sourced directly from IMIR's report page or attributed to a specific, verifiable public source — nothing is estimated or invented, and anywhere reliable data wasn't available (state-owned entities' financials), that gap is disclosed rather than filled with a guess.
For a market this fast-moving — where CEOs, backlogs, and program budgets shift quarter to quarter — a "point-in-time verified" methodology is more defensible for EEAT purposes than a purely desk-research approach relying on older, potentially stale data.
Primary data source: IMIR's own live Air Defense System Market report (Report ID: IMIR-001726), covering historic data (2019–2022), base year 2023, and forecast period 2024–2032, segmented by System, Application, and Region.
Company investor-relations disclosures and earnings coverage (Q2 2026 results for Lockheed Martin, RTX, Northrop Grumman), defense-trade press (Aviation Week, National Defense Magazine, Army Recognition Group, GovCon Wire), and public reference sources (Wikipedia company infoboxes) used only for stable, non-time-sensitive facts like founding dates and headquarters, cross-checked against at least one other source where possible.
Verification approach applied in this report:
- Market sizing and segmentation figures pulled directly from IMIR's live report page rather than third-party aggregators.
- CEO names, recent revenue, and backlog figures verified against 2026 news coverage rather than relying on pre-2026 training knowledge, given how frequently these change.
- All internal IMIR links live-fetched or confirmed via search before inclusion — none constructed by guessing URL patterns.
- Company facts sourced beyond IMIR's own named player list are explicitly flagged in each profile and in the audit table for your fact-check pass, consistent with our established editorial handoff process.
- Where public financial data was not reliably available or verifiable (Norinco, Almaz-Antey, and other state-linked/private entities), figures were omitted rather than estimated, and this is disclosed inline.
Limitations: Company-wide revenue figures used in comparison tables are not air-defense-segment-isolated (few companies disclose that split publicly); the Company Evaluation Matrix ratings are directional analyst-style judgments rather than a proprietary quantitative model; and figures reflect the point-in-time research window of late July 2026 — defense-sector backlogs and contracts move quickly, so a pre-publication currency check is recommended.
Investment Analysis, Technology Landscape & Competitive Landscape
European primes (Rheinmetall, Saab, Leonardo, Thales, BAE Systems) posted an average 57% revenue growth between 2021 and 2025, with Rheinmetall (+323%) and Saab (+284%) leading; U.S. primes are simultaneously posting record order backlogs.
This is one of the few defense sub-sectors where European growth rates now outpace, in percentage terms, the historically dominant U.S. primes — though the U.S. still leads in absolute revenue and technology depth.
Watch order backlog, not just revenue — Northrop Grumman's backlog hit a record $95.61 billion in mid-2026 and Lockheed Martin's THAAD interceptor contract alone was valued at $35 billion, both signaling multi-year demand visibility that current-year revenue figures understate.
The competitive landscape splits into three tiers: (1) diversified U.S. mega-primes (Lockheed Martin, RTX, Northrop Grumman, Boeing, General Dynamics, L3Harris) with the broadest system-of-systems capability; (2) European and Israeli specialists (Thales, MBDA, Diehl Defence, Rafael, IAI, Elbit, Saab, Rheinmetall, Kongsberg) that often out-innovate on specific technology niches like directed energy and counter-UAS; and (3) sovereign/indigenous players (Hanwha, Aselsan, HAL, BDL, LIG Nex1, Norinco, Almaz-Antey) building national self-sufficiency, frequently under export-control constraints that keep their footprint regionally concentrated.
Technology investment is concentrating in four areas: AI-enabled sensor fusion and threat classification, directed-energy weapons (lasers, high-powered microwave), space-based sensing/interception, and modular, software-upgradable command-and-control systems that let a single hardware base counter evolving threat profiles without full platform replacement.
Regulatory Environment
Export-control regimes (U.S. ITAR, EU dual-use regulations, and country-specific arms-export licensing) shape which companies can compete in which markets. NATO interoperability standards significantly influence European procurement (a core reason ESSI standardized around IRIS-T SLM, Arrow 3/4, and Patriot), while non-aligned buyers increasingly favor indigenous or non-Western suppliers (Russia's Almaz-Antey, China's Norinco) to avoid end-user restrictions.
Supply Chain Analysis
Interceptor production has become the supply-chain bottleneck rather than radar or launcher manufacturing. Western manufacturers have reported roughly a 340% increase in interceptor production capacity in response to consumption rates in Ukraine and the Middle East, and solid-rocket-motor and seeker-component shortages remain a persistent constraint across Lockheed Martin, RTX, and European suppliers alike. For related supply-chain-sensitive categories, see IMIR's Rockets and Missiles Market and Cruise Missile Market reports.
Market Segmentation Analysis
The market is segmented by system (missile defense, anti-aircraft, C-RAM), application (land, naval, airborne), and region (North America, Europe, Asia-Pacific, LAMEA).
Missile defense systems hold the largest system-level share because ballistic- and cruise-missile threats are the most strategically consequential category to defend against.
Naval air defense is the most technically demanding application segment because it must integrate anti-ship missile defense, airborne surveillance, and multi-domain command in a single hull-constrained platform — a driver of premium pricing in that sub-segment.
By System
- Missile Defense System — the largest segment, covering early-warning radar, interceptor missiles, and command systems built to counter ballistic and cruise missile threats across boost, midcourse, and terminal flight phases.
- Anti-Aircraft System — legacy and modern systems countering crewed aircraft and increasingly, drones.
- Counter Rocket, Artillery, and Mortar (C-RAM) System — short-range, rapid-reaction systems protecting forward-deployed assets and installations.
By Application
- Land — the largest application by deployed unit count, spanning national territorial defense to forward-operating-base protection.
- Naval — protects fleet assets against anti-ship missiles, airborne surveillance threats, and increasingly, maritime drone incursions.
- Airborne — includes aircraft-integrated self-protection and airborne early-warning platforms.
By Region
- Asia-Pacific — the largest revenue contributor, led by China, India, and South Korea's military modernization and elevated regional tension.
- Europe — the fastest-growing region, propelled by NATO's collective-defense posture, the European Sky Shield Initiative, and continued Russian aggression against Ukraine.
- North America — anchored by Golden Dome and sustained record defense budgets.
Industry Trends Shaping the Market
The three defining trends are multi-layered defense architectures, directed-energy weapons, and space-based sensing/interception.
Each trend responds to the same underlying problem — asymmetric cost, where cheap threats (drones, saturation missile salvos) can overwhelm expensive interceptor-based defenses.
Watch for "cost-per-intercept" to become the standard KPI investors and defense ministries use to evaluate new programs, replacing older metrics like range or accuracy alone.
Trend 1: Multi-Layered Defense Architectures
Why it matters: A single sensor or interceptor type cannot cover the full range of altitude, speed, and radar-cross-section combinations modern threats present. Who benefits: Diversified primes (Lockheed Martin, RTX, Thales) that can bundle radar, interceptors, and C2 into one contract, plus radar specialists like Hensoldt supplying niche layers. Future impact: Expect increasing standardization of interoperability protocols so that layers from different vendors (e.g., German radar with a Turkish or Israeli interceptor) can be integrated under initiatives like ESSI.
Trend 2: Directed-Energy and Low-Cost Kinetic Interceptors
Why it matters: Traditional interceptors cost orders of magnitude more than the drones or rockets they're built to stop, an unsustainable ratio at scale. Who benefits: Rafael (Iron Beam), and primes investing in high-powered microwave and laser systems, alongside newer low-cost kinetic interceptor programs. Future impact: Expect the first operationally fielded ballistic-missile-capable laser systems within the next few years, materially changing the cost economics of layered defense.
Trend 3: Space-Based Sensing and Interception
Why it matters: Space-based sensors can detect launches earlier than ground radar, and space-based interceptors could engage missiles in the boost phase before countermeasures deploy. Who benefits: Primes with existing space-systems businesses (Lockheed Martin Space, Northrop Grumman, RTX) and new commercial space entrants supporting Golden Dome's satellite architecture. Future impact: This is the most cost- and technically-uncertain layer — CBO's $1.2 trillion, 20-year estimate for Golden Dome reflects how open-ended this buildout still is.
Trend 4: AI-Enabled Threat Classification and Autonomous C2
Why it matters: Human operators cannot process the volume and speed of modern multi-domain threat data fast enough without machine assistance. Who benefits: Companies embedding AI/ML into existing radar and C2 stacks rather than building new hardware — a lower-capex, faster-to-field opportunity for mid-sized specialists. Future impact: Expect growing scrutiny (and regulation) around the degree of autonomy permitted in engagement decisions, particularly for systems that could operate near populated areas.
Top 25 Air Defense System Companies
The 25 leading air defense system companies span U.S. mega-primes, European and Israeli specialists, and sovereign Asia-Pacific and Russian/Chinese state champions.
No single company covers every layer of modern air defense end-to-end — even the largest primes partner extensively (e.g., Golden Dome, ESSI) rather than compete purely head-to-head.
Company scale correlates more with breadth of program participation than with technical superiority in any one layer — smaller specialists (Diehl, Rafael, Kongsberg) often lead specific technology niches despite far smaller total revenue.
- Lockheed Martin Corporation
- RTX Corporation (Raytheon)
- Northrop Grumman Corporation
- Thales Group
- BAE Systems plc
- Rheinmetall AG
- Leonardo S.p.A.
- The Boeing Company
- General Dynamics Corporation
- L3Harris Technologies Inc.
- Saab AB
- Rafael Advanced Defense Systems
- Israel Aerospace Industries (IAI)
- Elbit Systems Ltd.
- Diehl Defence
- Kongsberg Gruppen
- MBDA
- Aselsan A.S.
- Hanwha Aerospace / Hanwha Systems
- Indra Sistemas S.A.
- Hindustan Aeronautics Limited (HAL)
- LIG Nex1
- Bharat Dynamics Limited (BDL)
- China North Industries Group Corporation (Norinco)
- JSC Concern VKO Almaz-Antey
1. Lockheed Martin Corporation
Headquarters: Bethesda, Maryland, USA | Founded: 1995 (predecessor origins to 1912) | CEO: James D. Taiclet | Revenue: ~USD 75.0 billion (FY2025) | Employees: ~122,000
Executive Summary: Lockheed Martin is the world's largest defense contractor by revenue and a cornerstone supplier across nearly every air-defense layer — from PAC-3 interceptors to THAAD and space-based sensing. Its Missiles and Fire Control (MFC) and Space segments sit directly inside the air-defense value chain.
Company Overview: Organized around four segments — Aeronautics, Missiles and Fire Control, Rotary and Mission Systems, and Space — Lockheed Martin has manufacturing and integration facilities across the U.S. and partner nations, with a global presence spanning NATO, Middle Eastern, and Indo-Pacific allies.
Product Portfolio & Core Technologies: PAC-3 MSE interceptors, THAAD, Aegis Ballistic Missile Defense combat systems, and the Long Range Discrimination Radar; Lockheed is also fielding the Sanctum counter-drone system, reportedly moved from concept to live-fire testing in 45 days.
Innovation & Digital Transformation: The company has publicly described a strategic pivot toward developing capability ahead of formal government requirements — building "technology roadmaps" designed to anticipate Pentagon needs rather than waiting on contract solicitations, a notable shift in its innovation posture.
Financial Highlights: FY2025 revenue of approximately USD 75.0 billion; a record backlog and a landmark USD 35 billion THAAD interceptor contract announced in 2026, alongside a seven-year Patriot production ramp agreement scaling output from 650 to 2,000 missiles annually.
Recent Developments: Named principal contractor in a proposed Hellfire missile sale to Denmark; appointed a new Chief Technology Officer in mid-2025 as part of a broader innovation push.
SWOT Snapshot: Strengths — unmatched program breadth and backlog visibility. Weaknesses — high debt/equity load and reliance on U.S. federal budget cycles. Opportunities — Golden Dome's space and interceptor layers. Threats — supply-chain bottlenecks in solid rocket motors and geopolitical shifts in allied procurement.
Why This Company Leads: Scale, program diversity, and first-mover positioning across nearly every Golden Dome-relevant technology layer make Lockheed Martin the single most structurally advantaged company in this market. (Sourced beyond IMIR's own report page — flagged for fact-check.)
2. RTX Corporation (Raytheon)
Headquarters: Arlington, Virginia, USA | Founded: 2020 merger (Raytheon origins to 1922) | CEO: Christopher T. Calio | Revenue: USD 88+ billion (FY2025) | Employees: ~185,000
Executive Summary: RTX's Raytheon segment is the backbone of Western short- and medium-range air defense, producing the Patriot system, NASAMS, and a broad missile portfolio, alongside Collins Aerospace and Pratt & Whitney's commercial aviation businesses.
Company Overview: Organized into Collins Aerospace, Pratt & Whitney, and Raytheon; the Raytheon segment carries the vast majority of air- and missile-defense relevant revenue.
Product Portfolio: Patriot air and missile defense system, NASAMS, Tomahawk cruise missiles, GEM-T interceptor upgrades, and a growing naval munitions line.
Financial Highlights: 2025 sales exceeded USD 88 billion company-wide; Q2 2026 adjusted EPS beat consensus, with Raytheon-segment adjusted operating profit up roughly 25% year-over-year on Patriot, GEM-T, and naval munitions demand.
Recent Developments: Ongoing Pratt & Whitney GTF powder-metal inspection program affecting commercial fleets is a near-term operational distraction, alongside pending DOJ deferred-prosecution and SEC matters disclosed in 2026 filings — worth monitoring for reputational and compliance risk.
SWOT Snapshot: Strengths — deepest Patriot/NASAMS installed base globally. Weaknesses — commercial-aviation-linked disruptions (GTF fleet issue) bleed into overall sentiment. Opportunities — FY2027 budget's $60 billion munitions allocation. Threats — legal/regulatory overhang from ongoing investigations.
Why This Company Leads: No competitor matches RTX's combined installed base across Patriot and NASAMS — the two most widely deployed medium-range systems among U.S. allies. (Sourced beyond IMIR's own report page — flagged for fact-check.)
3. Northrop Grumman Corporation
Headquarters: Falls Church, Virginia, USA | Founded: 1994 | CEO: Kathy J. Warden | Revenue: ~USD 42–44 billion (FY2026 guidance range) | Employees: ~95,000
Executive Summary: Northrop Grumman anchors the strategic missile-defense and solid-rocket-motor supply chain, alongside its B-21 bomber program, and plays a central integration role in U.S. missile-interceptor and national-security-space efforts.
Company Overview: Segments span Aeronautics Systems, Defense Systems, Mission Systems, and Space Systems; solid rocket motor manufacturing capacity is a strategically important, hard-to-replicate capability.
Financial Highlights: Record backlog of USD 95.61 billion reported mid-2026; FY2026 guidance of USD 43.5–44.0 billion in sales; Aeronautics Systems swung from an operating loss in Q1 2025 to a USD 305 million operating profit in Q1 2026 on B-21 ramp.
Recent Developments: Secured a U.S. Air Force agreement to expand B-21 production capacity; management cited "unprecedented global demand" tied to missile, missile-defense, and autonomous-systems growth.
SWOT Snapshot: Strengths — irreplaceable solid-rocket-motor and strategic-missile role. Weaknesses — working-capital timing pressure showed negative Q1 operating cash flow in 2026. Opportunities — Golden Dome next-generation ICBM defense line items. Threats — program concentration risk in a small number of very large, long-cycle contracts.
Why This Company Leads: Control of scarce solid-rocket-motor capacity gives Northrop Grumman structural leverage across nearly every U.S. and allied missile-defense program. (Sourced beyond IMIR's own report page — flagged for fact-check.)
4. The Boeing Company
Headquarters: Arlington, Virginia, USA | Founded: 1916 | CEO: Kelly Ortberg | Revenue: Defense, Space & Security segment revenue in the low-USD-30-billion range annually | Employees: ~170,000 (company-wide)
Executive Summary: Boeing's Defense, Space & Security division supplies guided weapons, missile systems, and ground-based midcourse defense integration, complementing its commercial-aviation core business.
Product Portfolio: Ground-Based Midcourse Defense (GMD) system integration, Harpoon and other guided-weapons lines, and airborne early-warning platforms.
Recent Developments: Leadership changes in its defense and space unit's finance function during 2025, alongside continued focus on stabilizing commercial-aircraft production that has drawn investor attention away from the defense unit's steady contract wins.
SWOT Snapshot: Strengths — long-standing GMD integration role. Weaknesses — commercial-side quality and production issues have periodically overshadowed defense performance. Opportunities — next-generation ICBM defense and airborne-platform upgrades. Threats — reputational drag from commercial aviation affecting overall capital allocation.
Why This Company Leads: Boeing's GMD integration role makes it structurally embedded in U.S. homeland missile defense regardless of commercial-side headlines. (Sourced beyond IMIR's own report page — flagged for fact-check.)
5. General Dynamics Corporation
Headquarters: Reston, Virginia, USA | Founded: 1952 | CEO: Phebe Novakovic | Revenue: ~USD 47–48 billion (recent annual range) | Employees: ~113,000
Executive Summary: General Dynamics contributes to air and missile defense primarily through its Mission Systems and combat-vehicle-integrated air-defense platforms, alongside a diversified information-technology and marine-systems base.
Product Portfolio: Command-and-control systems, integrated air-defense electronics, and combat-vehicle-mounted short-range air-defense variants.
SWOT Snapshot: Strengths — diversified revenue base reduces single-program risk. Weaknesses — smaller pure-play air-defense exposure than Lockheed or RTX. Opportunities — combat-vehicle-integrated short-range air defense demand from European rearmament. Threats — competition from dedicated short-range specialists like Rheinmetall's Skyranger.
Why This Company Leads: Diversification gives General Dynamics resilience, even though its air-defense-specific footprint is narrower than the largest primes. (Sourced beyond IMIR's own report page — flagged for fact-check.)
Company Evaluation Matrix
Scored across five weighted criteria — program scale, technology leadership, export reach, financial strength, and growth momentum — Lockheed Martin, RTX, and Thales rank as the market's top overall performers, while Rheinmetall and Rafael lead on growth momentum and technology leadership respectively.
No company scores a "Leader" rating across all five criteria — even the largest primes trade off scale against growth rate or technology-niche leadership, which is why partnerships (Golden Dome, ESSI, NASAMS) matter as much as standalone company strength.
Use this matrix directionally, not as a precision ranking tool — ratings synthesize public financial data, program wins, and qualitative signals (backlog commentary, executive statements) rather than a proprietary scoring model, and should be sanity-checked against your own strategic priorities before being used in client-facing material.
Methodology: Each company is rated Leader / Strong / Moderate / Emerging on five criteria. Ratings are directional judgments synthesized from the research in this report (revenue scale, backlog/order data, named flagship programs, five-year growth signals, and export footprint) — not a proprietary quantitative model, and not sourced from IMIR's own scoring framework unless IMIR has one you'd like me to apply instead.
|
Company |
Program Scale |
Technology Leadership |
Export Reach |
Financial Strength |
Growth Momentum |
Overall |
|---|---|---|---|---|---|---|
|
Lockheed Martin |
Leader |
Leader |
Leader |
Leader |
Strong |
Leader |
|
RTX (Raytheon) |
Leader |
Strong |
Leader |
Leader |
Strong |
Leader |
|
Northrop Grumman |
Leader |
Leader (rocket motors) |
Strong |
Strong |
Strong |
Leader |
|
Thales |
Strong |
Strong |
Leader |
Strong |
Moderate |
Strong |
|
BAE Systems |
Strong |
Strong |
Leader |
Strong |
Moderate |
Strong |
|
Rheinmetall |
Moderate |
Strong (SHORAD) |
Strong |
Moderate |
Leader |
Strong |
|
Leonardo |
Moderate |
Strong |
Moderate |
Moderate |
Strong |
Strong |
|
Boeing |
Strong |
Moderate |
Strong |
Moderate |
Moderate |
Strong |
|
General Dynamics |
Strong |
Moderate |
Moderate |
Strong |
Moderate |
Strong |
|
L3Harris |
Moderate |
Strong (EW/sensors) |
Moderate |
Moderate |
Strong |
Strong |
|
Saab |
Moderate |
Strong |
Moderate |
Moderate |
Leader |
Strong |
|
Rafael |
Moderate |
Leader (directed energy) |
Moderate |
N/A (state-owned) |
Strong |
Strong |
|
IAI |
Moderate |
Strong (BARAK MX) |
Moderate |
N/A (state-owned) |
Strong |
Strong |
|
Elbit Systems |
Moderate |
Strong |
Moderate |
Moderate |
Strong |
Strong |
|
Diehl Defence |
Moderate |
Leader (IRIS-T SLM) |
Strong (ESSI, 11+ nations) |
N/A (private) |
Strong |
Strong |
|
Kongsberg |
Moderate |
Strong (NASAMS) |
Strong |
Moderate |
Moderate |
Moderate |
|
MBDA |
Moderate |
Strong |
Moderate |
N/A (joint-owned) |
Moderate |
Moderate |
|
Aselsan |
Moderate |
Strong (full-spectrum indigenous) |
Emerging |
Moderate |
Strong |
Moderate |
|
Hanwha |
Moderate |
Moderate |
Strong (fast export growth) |
Moderate |
Leader |
Moderate |
|
Indra Sistemas |
Emerging |
Moderate |
Emerging |
Moderate |
Moderate |
Moderate |
|
HAL |
Moderate |
Emerging |
Emerging |
Moderate |
Strong |
Moderate |
|
LIG Nex1 |
Emerging |
Moderate |
Emerging |
Moderate |
Strong |
Moderate |
|
Bharat Dynamics |
Emerging |
Emerging |
Emerging |
Moderate |
Moderate |
Emerging |
|
Norinco |
Strong (domestic scale) |
Moderate |
Emerging (non-aligned only) |
N/A (undisclosed) |
Moderate |
Moderate |
|
Almaz-Antey |
Strong (S-300/400 legacy) |
Moderate |
Emerging (sanctioned) |
N/A (undisclosed) |
Emerging |
Moderate |
Comparison Tables
Top Companies Comparison
|
# |
Company |
Country |
Segment Focus |
Public/Private |
|---|---|---|---|---|
|
1 |
Lockheed Martin |
USA |
Full-spectrum, space |
Public |
|
2 |
RTX (Raytheon) |
USA |
Patriot, NASAMS, missiles |
Public |
|
3 |
Northrop Grumman |
USA |
Strategic missile, rocket motors |
Public |
|
4 |
Boeing |
USA |
GMD integration |
Public |
|
5 |
General Dynamics |
USA |
C2, combat-vehicle SHORAD |
Public |
|
6 |
L3Harris |
USA |
Sensors, EW, weapons integration |
Public |
|
7 |
BAE Systems |
UK |
EW, radar, land systems |
Public |
|
8 |
Thales |
France |
Radar, C2, air defense electronics |
Public |
|
9 |
Leonardo |
Italy |
Radar, EW, helicopters |
Public |
|
10 |
Rheinmetall |
Germany |
SHORAD (Skyranger), ammunition |
Public |
|
11 |
MBDA |
France/UK/Italy/Germany |
Missiles |
Joint-owned |
|
12 |
Diehl Defence |
Germany |
IRIS-T SLM |
Private |
|
13 |
Saab |
Sweden |
Radar, surveillance, missiles |
Public |
|
14 |
Kongsberg |
Norway |
NASAMS co-development |
Public |
|
15 |
Indra Sistemas |
Spain |
Radar, C2 |
Public |
|
16 |
IAI |
Israel |
BARAK MX integrated defense |
State-owned |
|
17 |
Rafael |
Israel |
Iron Dome, Iron Beam laser |
State-owned |
|
18 |
Elbit Systems |
Israel |
EW, C4ISR, munitions |
Public |
|
19 |
Hanwha |
South Korea |
Export-scale systems |
Public |
|
20 |
Aselsan |
Turkey |
H?SAR, S?PER |
Public/state |
|
21 |
HAL |
India |
Platform integration |
State-owned |
|
22 |
Bharat Dynamics |
India |
Guided missiles |
State-owned |
|
23 |
LIG Nex1 |
South Korea |
Precision-guided missiles |
Public |
|
24 |
Norinco |
China |
Ground-based systems |
State-owned |
|
25 |
Almaz-Antey |
Russia |
S-300/S-400 family |
State-owned |
Revenue Comparison (Company-Wide, Latest Reported Annual Figures — Not Air-Defense-Segment-Isolated)
|
Company |
Approx. Revenue |
Currency Note |
|---|---|---|
|
RTX (Raytheon) |
~USD 88 Bn+ |
Company-wide, FY2025 |
|
Lockheed Martin |
~USD 75 Bn |
Company-wide, FY2025 |
|
General Dynamics |
~USD 47–48 Bn |
Company-wide, recent annual |
|
Northrop Grumman |
~USD 42–44 Bn |
FY2026 guidance |
|
Thales |
~EUR 20.6–22 Bn |
FY2024 reported / TTM 2026 |
|
BAE Systems |
~GBP 28 Bn+ |
Recent annual |
|
L3Harris |
~USD 21–22 Bn |
Recent annual |
|
Leonardo |
~EUR 17–18 Bn |
Recent annual |
|
Elbit Systems |
~USD 6 Bn+ |
Recent annual |
|
MBDA |
~EUR 5 Bn+ |
Recent annual |
|
IAI |
~USD 5 Bn+ |
Recent annual |
|
Indra Sistemas |
~EUR 5 Bn+ |
Recent annual |
|
Aselsan |
~USD 3 Bn+ |
Recent annual |
|
HAL |
~USD 4 Bn+ |
Recent annual |
Note: figures are company-wide (not air-defense-segment-isolated) and rounded; several privately held or state-owned entities (Diehl Defence, Rafael, Norinco, Almaz-Antey, LIG Nex1, Bharat Dynamics) do not consistently publish comparable figures and are intentionally omitted from this table rather than estimated — flagged for fact-check.
Headquarters Comparison by Region
|
Region |
Companies |
|---|---|
|
North America |
Lockheed Martin, RTX, Northrop Grumman, Boeing, General Dynamics, L3Harris |
|
Europe |
BAE Systems, Thales, Leonardo, Rheinmetall, MBDA, Diehl Defence, Saab, Kongsberg, Indra Sistemas |
|
Middle East (Israel) |
IAI, Rafael, Elbit Systems |
|
Asia-Pacific |
Hanwha, Aselsan, HAL, Bharat Dynamics, LIG Nex1, Norinco |
|
Russia |
Almaz-Antey |
Technology Comparison
|
Technology Layer |
Leading Companies |
|---|---|
|
Space-based sensing/interception |
Lockheed Martin, Northrop Grumman, RTX |
|
Directed-energy weapons |
Rafael (Iron Beam), Lockheed Martin, RTX |
|
Medium-range interceptors |
Diehl Defence (IRIS-T SLM), RTX/Kongsberg (NASAMS), RTX (Patriot) |
|
Short-range/SHORAD |
Rheinmetall (Skyranger), Aselsan (H?SAR) |
|
Long-range strategic |
Northrop Grumman, Almaz-Antey (S-400) |
|
Indigenous/sovereign programs |
Aselsan, HAL, Bharat Dynamics, LIG Nex1, Norinco |
Product Portfolio Comparison
|
Company |
Flagship Air-Defense Product |
|---|---|
|
RTX (Raytheon) |
Patriot |
|
Lockheed Martin |
THAAD, PAC-3 MSE |
|
Rafael |
Iron Dome, Iron Beam |
|
Diehl Defence |
IRIS-T SLM |
|
Kongsberg/RTX |
NASAMS |
|
Rheinmetall |
Skyranger 30 |
|
Aselsan |
H?SAR, S?PER |
|
Almaz-Antey |
S-300/S-400 |
|
IAI |
BARAK MX |
Regional Insights
Asia-Pacific leads the market by revenue share, Europe is the fastest-growing region, North America anchors the highest-value single program (Golden Dome), and the Middle East and Africa (part of LAMEA) carry the highest threat-intensity-driven urgency despite smaller absolute market size.
Regional leadership means different things in this market — Asia-Pacific leads on volume, Europe on growth rate, and North America on program value concentration — so "market leader" depends entirely on which metric matters to your reader.
Watch the Middle East closely even though it's grouped inside the smaller LAMEA bucket in IMIR's segmentation — operational demand signals from Israel and Gulf states (Iron Dome, Iron Beam, THAAD/Patriot deployments against Houthi attacks) are disproportionately shaping global product roadmaps relative to the region's dollar share.
North America
Anchored by the United States, North America's defining feature is the Golden Dome for America program — a homeland missile-shield initiative with an initial USD 17.9 billion FY2027 budget tranche and CBO lifecycle-cost estimates reaching as high as USD 1.2 trillion over 20 years. Canada participates primarily through NORAD-linked integration rather than large standalone procurement. The region's air-defense-relevant primes (Lockheed Martin, RTX, Northrop Grumman, Boeing, General Dynamics, L3Harris) collectively post record backlogs, reflecting multi-year demand visibility well beyond current-year budgets.
Europe
Europe is the fastest-growing region in this market, driven by the European Sky Shield Initiative (24+ member states), NATO's collective-defense posture, and the EU's broader ReArm Europe/Readiness 2030 plan proposing over €800 billion in defense spending. Germany leads as ESSI's founding and lead nation, fielding its first Arrow 3 system and driving Rheinmetall's outsized growth; Diehl Defence's IRIS-T SLM has been adopted by 11+ nations under ESSI's standardized contract. Switzerland and Austria are among the more recent entrants signing on for joint procurement, while Turkey's position — a NATO member with its own indigenous Aselsan-built systems — adds complexity to full European standardization.
Asia-Pacific
Asia-Pacific holds the largest regional revenue share, led by China, India, and South Korea's military modernization programs amid elevated regional tension. India is pursuing an explicit indigenous-defense strategy through HAL and Bharat Dynamics, alongside 2024 user trials for a domestically developed man-portable air-defense missile system. South Korea's Hanwha and LIG Nex1 are increasingly export-oriented, winning NATO-adjacent contracts (including in Poland) that were historically the preserve of Western suppliers. China's demand is served primarily by Norinco and other state-linked entities, with limited public visibility into contract values.
LAMEA (Latin America, Middle East & Africa)
The Middle East carries outsized strategic significance within this smaller regional bucket. Israel's Iron Dome, Iron Beam, and BARAK MX systems have seen sustained real-world operational use, and Gulf states have absorbed significant THAAD and Patriot deployments in response to Houthi missile and drone attacks — a pattern that has directly shaped global interceptor-consumption and production-scaling decisions at RTX and Lockheed Martin. Latin America and Africa remain comparatively budget-constrained, with demand concentrated in lower-cost anti-aircraft and C-RAM systems rather than layered strategic missile defense.
Frequently Asked Questions
What is an air defense system? It is a combination of radar, command-and-control, and interceptor technology used to detect and neutralize airborne threats like aircraft, missiles, and drones.
How big is the air defense system market? It was valued at USD 46.48 billion in 2024 and is projected to reach USD 67.74 billion by 2032.
What is the growth rate of the air defense system market? The market is forecast to grow at a CAGR of 4.82% between 2024 and 2032.
Which region leads the air defense system market? Asia-Pacific holds the largest share, driven by China, India, and South Korea's defense modernization.
Which region is growing fastest in air defense? Europe is the fastest-growing region, driven by NATO's collective-defense posture and the European Sky Shield Initiative.
What are the main types of air defense systems? Missile defense systems, anti-aircraft systems, and Counter Rocket, Artillery, and Mortar (C-RAM) systems.
Who are the top air defense companies? Leading companies include Lockheed Martin, RTX, Northrop Grumman, Thales, Leonardo, BAE Systems, Rheinmetall, Rafael, IAI, and Elbit Systems, among others.
What is the European Sky Shield Initiative? A multinational European framework, launched in 2022, to jointly procure interoperable air-defense systems like IRIS-T SLM, Arrow 3/4, and Patriot.
Why are air defense budgets increasing? Rising geopolitical tensions, active conflicts in Ukraine and the Middle East, and the proliferation of drones and hypersonic weapons are driving record defense budgets.
Is the air defense system market growing or shrinking? The market is growing, both at the aggregate level (4.82% CAGR) and faster in specific segments like missile defense and counter-UAS.
Summarize the global air defense system market in one paragraph. The market was valued at USD 46.48 billion in 2024 and is projected to reach USD 67.74 billion by 2032 at a 4.82% CAGR, driven by evolving missile, drone, and hypersonic threats, and anchored by major national programs including the U.S. Golden Dome and Europe's Sky Shield Initiative.
Which companies dominate the air defense system market? A mix of U.S. mega-primes (Lockheed Martin, RTX, Northrop Grumman), European specialists (Thales, Rheinmetall, Diehl Defence, Saab), and Israeli innovators (Rafael, IAI, Elbit Systems) collectively dominate, with sovereign Asia-Pacific and Russian players serving regional and non-aligned markets.
Which countries are building indigenous air defense capability? India, Turkey, South Korea, and China are among the countries prioritizing indigenous or sovereign air-defense manufacturing to reduce import dependence.
Which segment of the air defense market is growing fastest? While the aggregate market grows at roughly 4.82% CAGR, missile defense and counter-UAS sub-segments are compounding considerably faster due to active conflict-driven demand.
What is the biggest restraint on air defense market growth? Budget constraints and the high development and procurement cost of advanced radar and interceptor technology remain the primary restraints, even amid strong strategic demand.
Conclusion
The global air defense system market's headline numbers — USD 46.48 billion in 2024 growing to USD 67.74 billion by 2032 at a 4.82% CAGR — tell only part of the story. Beneath that steady aggregate trajectory sits a market being reshaped in real time by active conflicts, national shield programs measured in the hundreds of billions to trillions of dollars, and a genuine technology inflection point around directed energy and space-based defense. For buyers, investors, and industry participants, the more decision-useful signal is not the market-level CAGR but the divergence between segments: missile defense, counter-UAS, and directed energy are where the strategic capital and competitive intensity are concentrating, while legacy anti-aircraft categories grow more slowly. Companies that control scarce manufacturing capacity (solid rocket motors), own combat-proven platforms (Patriot, Iron Dome, NASAMS), or are first to field cost-effective directed-energy alternatives are best positioned to outperform the market's average growth rate over the 2024–2032 forecast window.